 Trama
Compare experiments
t-tests (also lognormal and TOST equivalence), exact rank tests, ordinary, Welch and Brown–Forsythe ANOVA, repeated measures, REML mixed models with Kenward–Roger, multiple comparisons and compact letters on the graph.
Trama brings worksheets, statistical analyses and scientific graphs together in one Windows application. Paste from Excel, pick a method, refine the figure and export to SVG or PDF. It is free, open source and needs no installation.
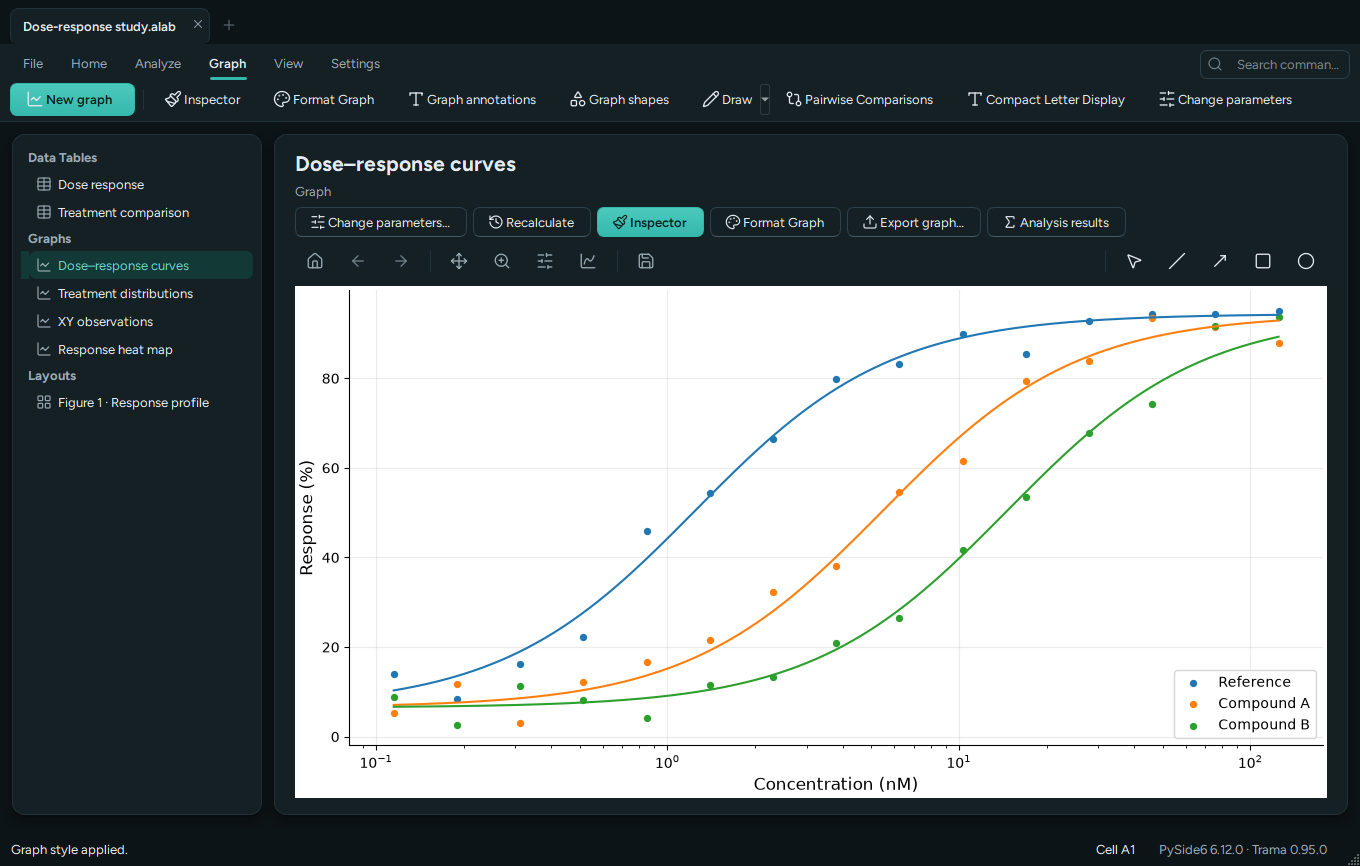
Trama 0.95 on Windows. Dose–response study with synthetic data.
We do not claim “more methods than anyone”: coverage is still partial, and we say so below. These are the points where Trama works differently from traditional commercial software, and where to check each one.
No cost, subscription or seat count. MIT licence: use it, study it and modify it, including in professional work.
Check: LICENSEExtract the ZIP folder and run Trama.exe. No Python to install, no account to create, no activation key to enter.
The application source imports no network module: no telemetry, no sync, no online licence check.
Check: search urllib, socketIn the simple case a .alab project is JSON text: open it in any editor, compare it with a diff, archive it without depending on the program.
An exact test says when it switched to an approximation and why. An interval that cannot be computed is explained, not filled in. The robust fit is descriptive: no invented standard errors or p-values. Analysis from summaries does not reconstruct artificial observations.
Check: features (it)Edit a value and the linked analyses recalculate. An excluded cell stays in the sheet and is left out of the calculation, not deleted.
Check: first experiment (it)Export to SVG, PDF (also multipage), PNG or TIFF. In native layouts, up to 12 panels, compatible vector parts stay vector; raster parts stay images.
Check: graphs and figures (it)Verification reports record the test environment, test outcomes and portable ZIP checksum. The link below is the 0.94 report.
0.94 verificationThe comparison is about how you work, not about a list of methods. The right-hand column describes what often happens: it does not refer to any particular product.
| Aspect | Trama | Traditional commercial software, usually |
|---|---|---|
| Cost | Free. MIT licence, professional use included. | A licence or subscription, per user or per seat. |
| Getting started | Portable folder: extract and run. No account, no activation key. | An installer; in some cases activation or an account sign-in. |
| Code and calculations | Public source, built on open libraries (NumPy, SciPy, statsmodels). You can read how a result is computed. | Closed code: results are checked by comparing them with other tools, not by reading the implementation. |
| Project file | In the simple case, JSON text that any editor can open. | Often a proprietary format that only the program that created it can read. |
| Data | Local files. The source contains no network code. | Varies by product: sync and data collection need checking case by case. |
| Continuity | With the MIT licence the code stays usable and modifiable even if the project stops. | Depends on the vendor: an expired licence or end of support can limit access to your own projects. |
Terms differ between vendors and change over time: check those of the program you use today. Trama does not claim equivalence with other programs or general superiority; the timing measurements in the repository describe synthetic workloads only and are not comparisons.
Real captures of the program, with synthetic data.
What’s new in 0.95 · The new Vetro interface uses Qt 6 with PySide6. Keep projects open in tabs, browse graphs in the Gallery and draw directly on figures.
Multicore calculation. Multicore calculation can spread work across processes for selected linked analyses, K-means, Monte Carlo studies, ROC bootstrap and paired permutations. Choose Automatic or set the number of processes in Settings → Multicore calculation. Speed gains depend on the calculation and the size of the dataset. In a Windows 11 VM with 10 logical CPUs and workers already running, 10,000 Monte Carlo replicates took 84 ms instead of 281 ms (3.32×), and ROC bootstrap took 0.53 s instead of 1.30 s (2.48×). These are medians of seven runs, with identical results from 1 to 8 processes. Benchmark data.
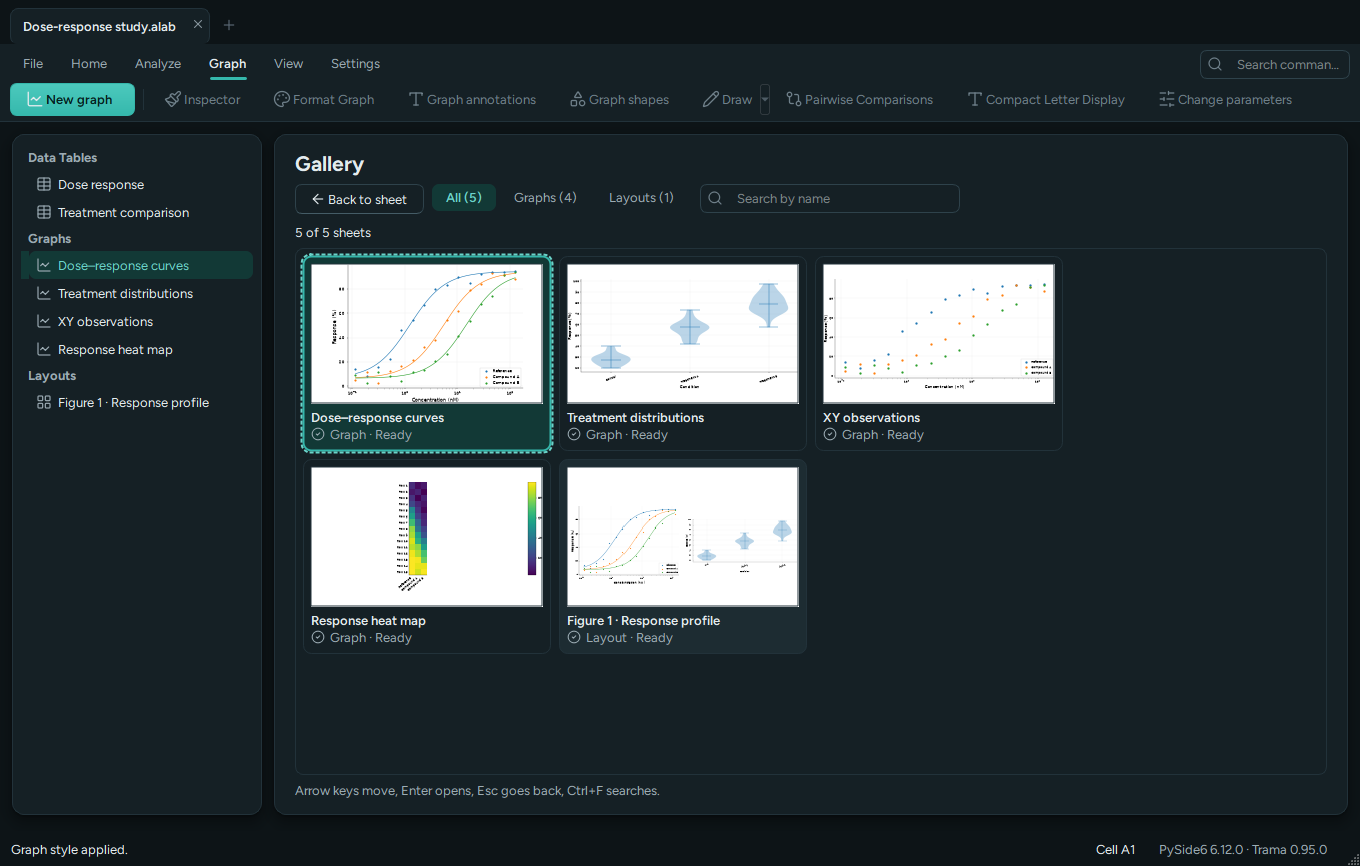
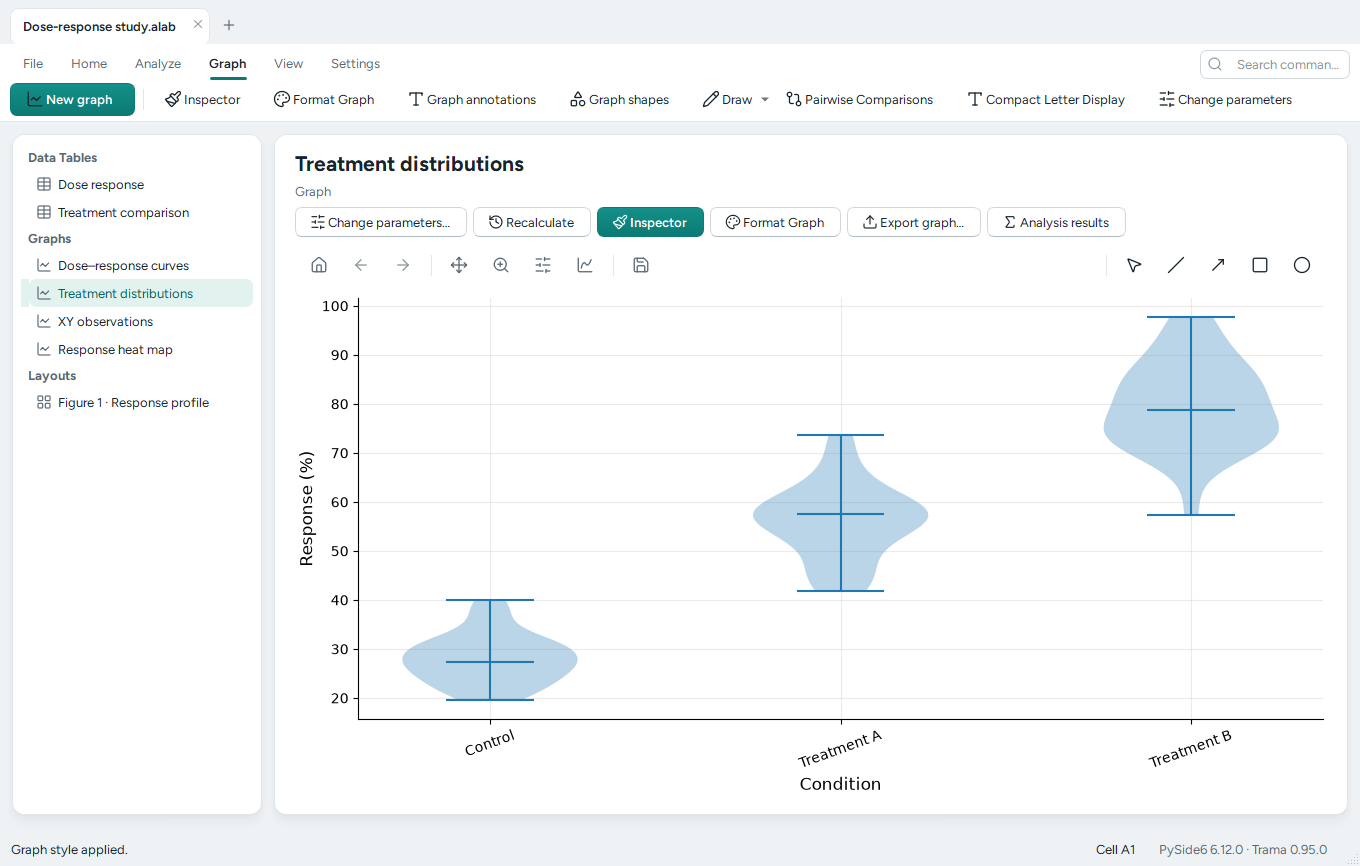
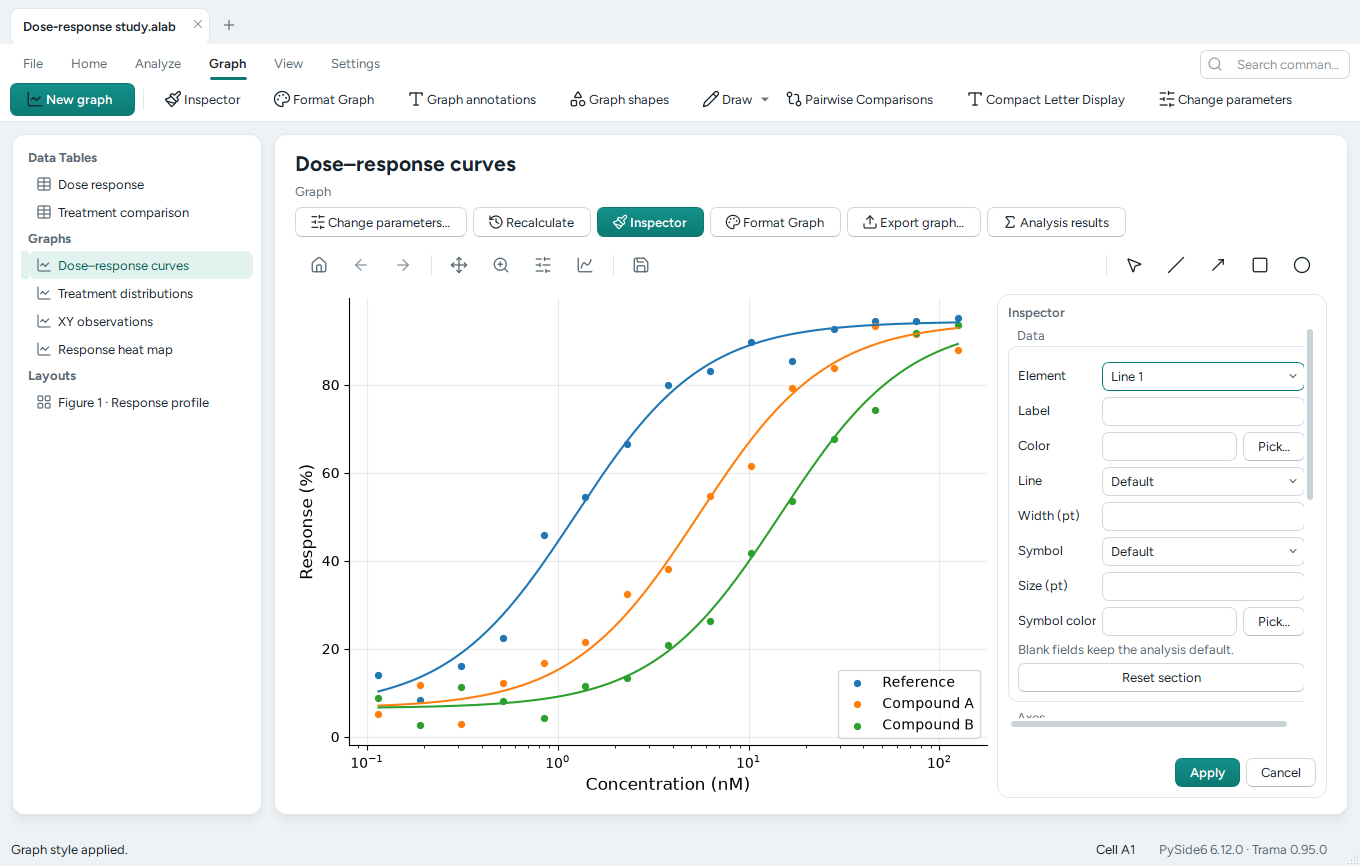
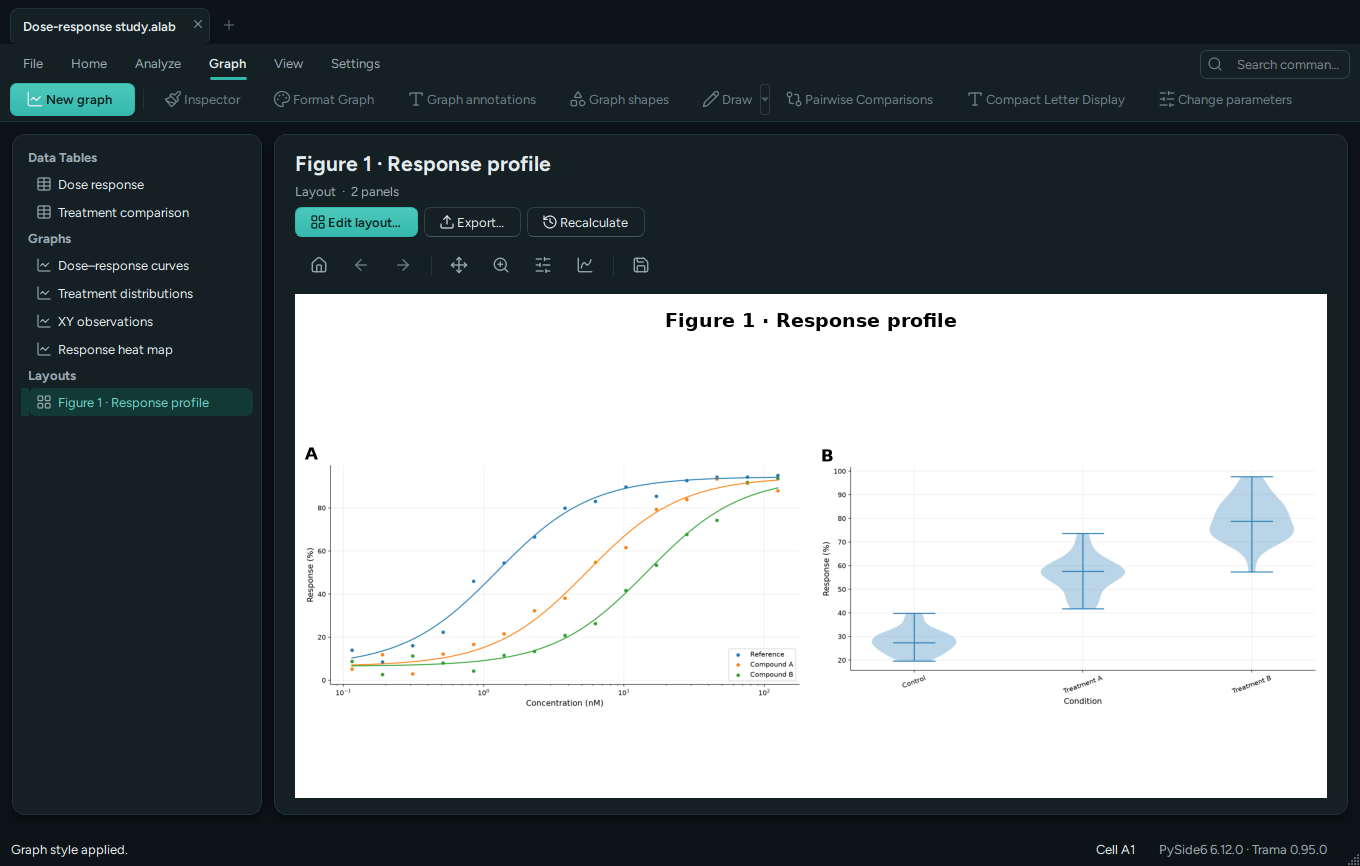
Six families of tools in 0.95.0 beta, from the same worksheet. Open the full map of formats and features.
t-tests (also lognormal and TOST equivalence), exact rank tests, ordinary, Welch and Brown–Forsythe ANOVA, repeated measures, REML mixed models with Kenward–Roger, multiple comparisons and compact letters on the graph.
Asymmetric parameter profiles; 118 catalogue equations in 14 families, custom and conditional equations with fixed thresholds, global fits with shared parameters, weighting, AICc comparison, direct and inverse calibration, splines, LOWESS and robust fits.
PCA with biplot, Lloyd and Hartigan–Wong K-means with a 17-index consensus and reports for each k, hierarchical clustering with dendrograms, merge maps and WCSS elbow plots, correlation matrices, heat maps and confidence ellipses.
Kaplan–Meier, Cox and competing risks, ROC curves with DeLong comparison, Bland–Altman, multiple, logistic and Poisson regression, contingency tables and diagnostic measures.
In-sheet formulas, transformations, baselines also with replicates, normalisation, area under the curve and peaks, Monte Carlo studies with a reproducible seed.
XY and column graphs, box and violin plots, forest and bubble plots, asymmetric error bars, native annotations and shapes, layouts up to 12 panels.
Full list, options and limits in the feature overview (Italian).
Better to know before you choose.
Short answers to the questions we hear most often.
About five minutes, nothing to install. Needs Windows 10 or 11, 64-bit, and a screen of at least 1024 × 768 pixels.
Get Trama-<version>-Windows-x64.zip from the releases page, not the source archive.
Extract the whole folder, keep the _internal folder next to the executable and run Trama.exe.
Download Laboratorio.alab and open it: synthetic data, a global fit and a ready-made layout.
Free, portable, in Italian and English.